4. Mind the gap
In this chapter, some social statistics are given about the tax revenue and the tax structure and about income inequality.
4.1 Tax revenue and tax structure of Belgium compared to OECD average
The first figure shows the total tax revenue as a share of GDP (the tax-to-GDP ratio) over time for Belgium and the OECD average (other countries can be added in the top left-hand corner). The next figures offer more detailed information for different types of taxes and contributions.
Source: OECD (2026), Revenue Statistics 2024 or latest available (accessed on 16 April 2026), https://www.compareyourcountry.org/tax-revenues/
General government gross debt as a percentage of GDP
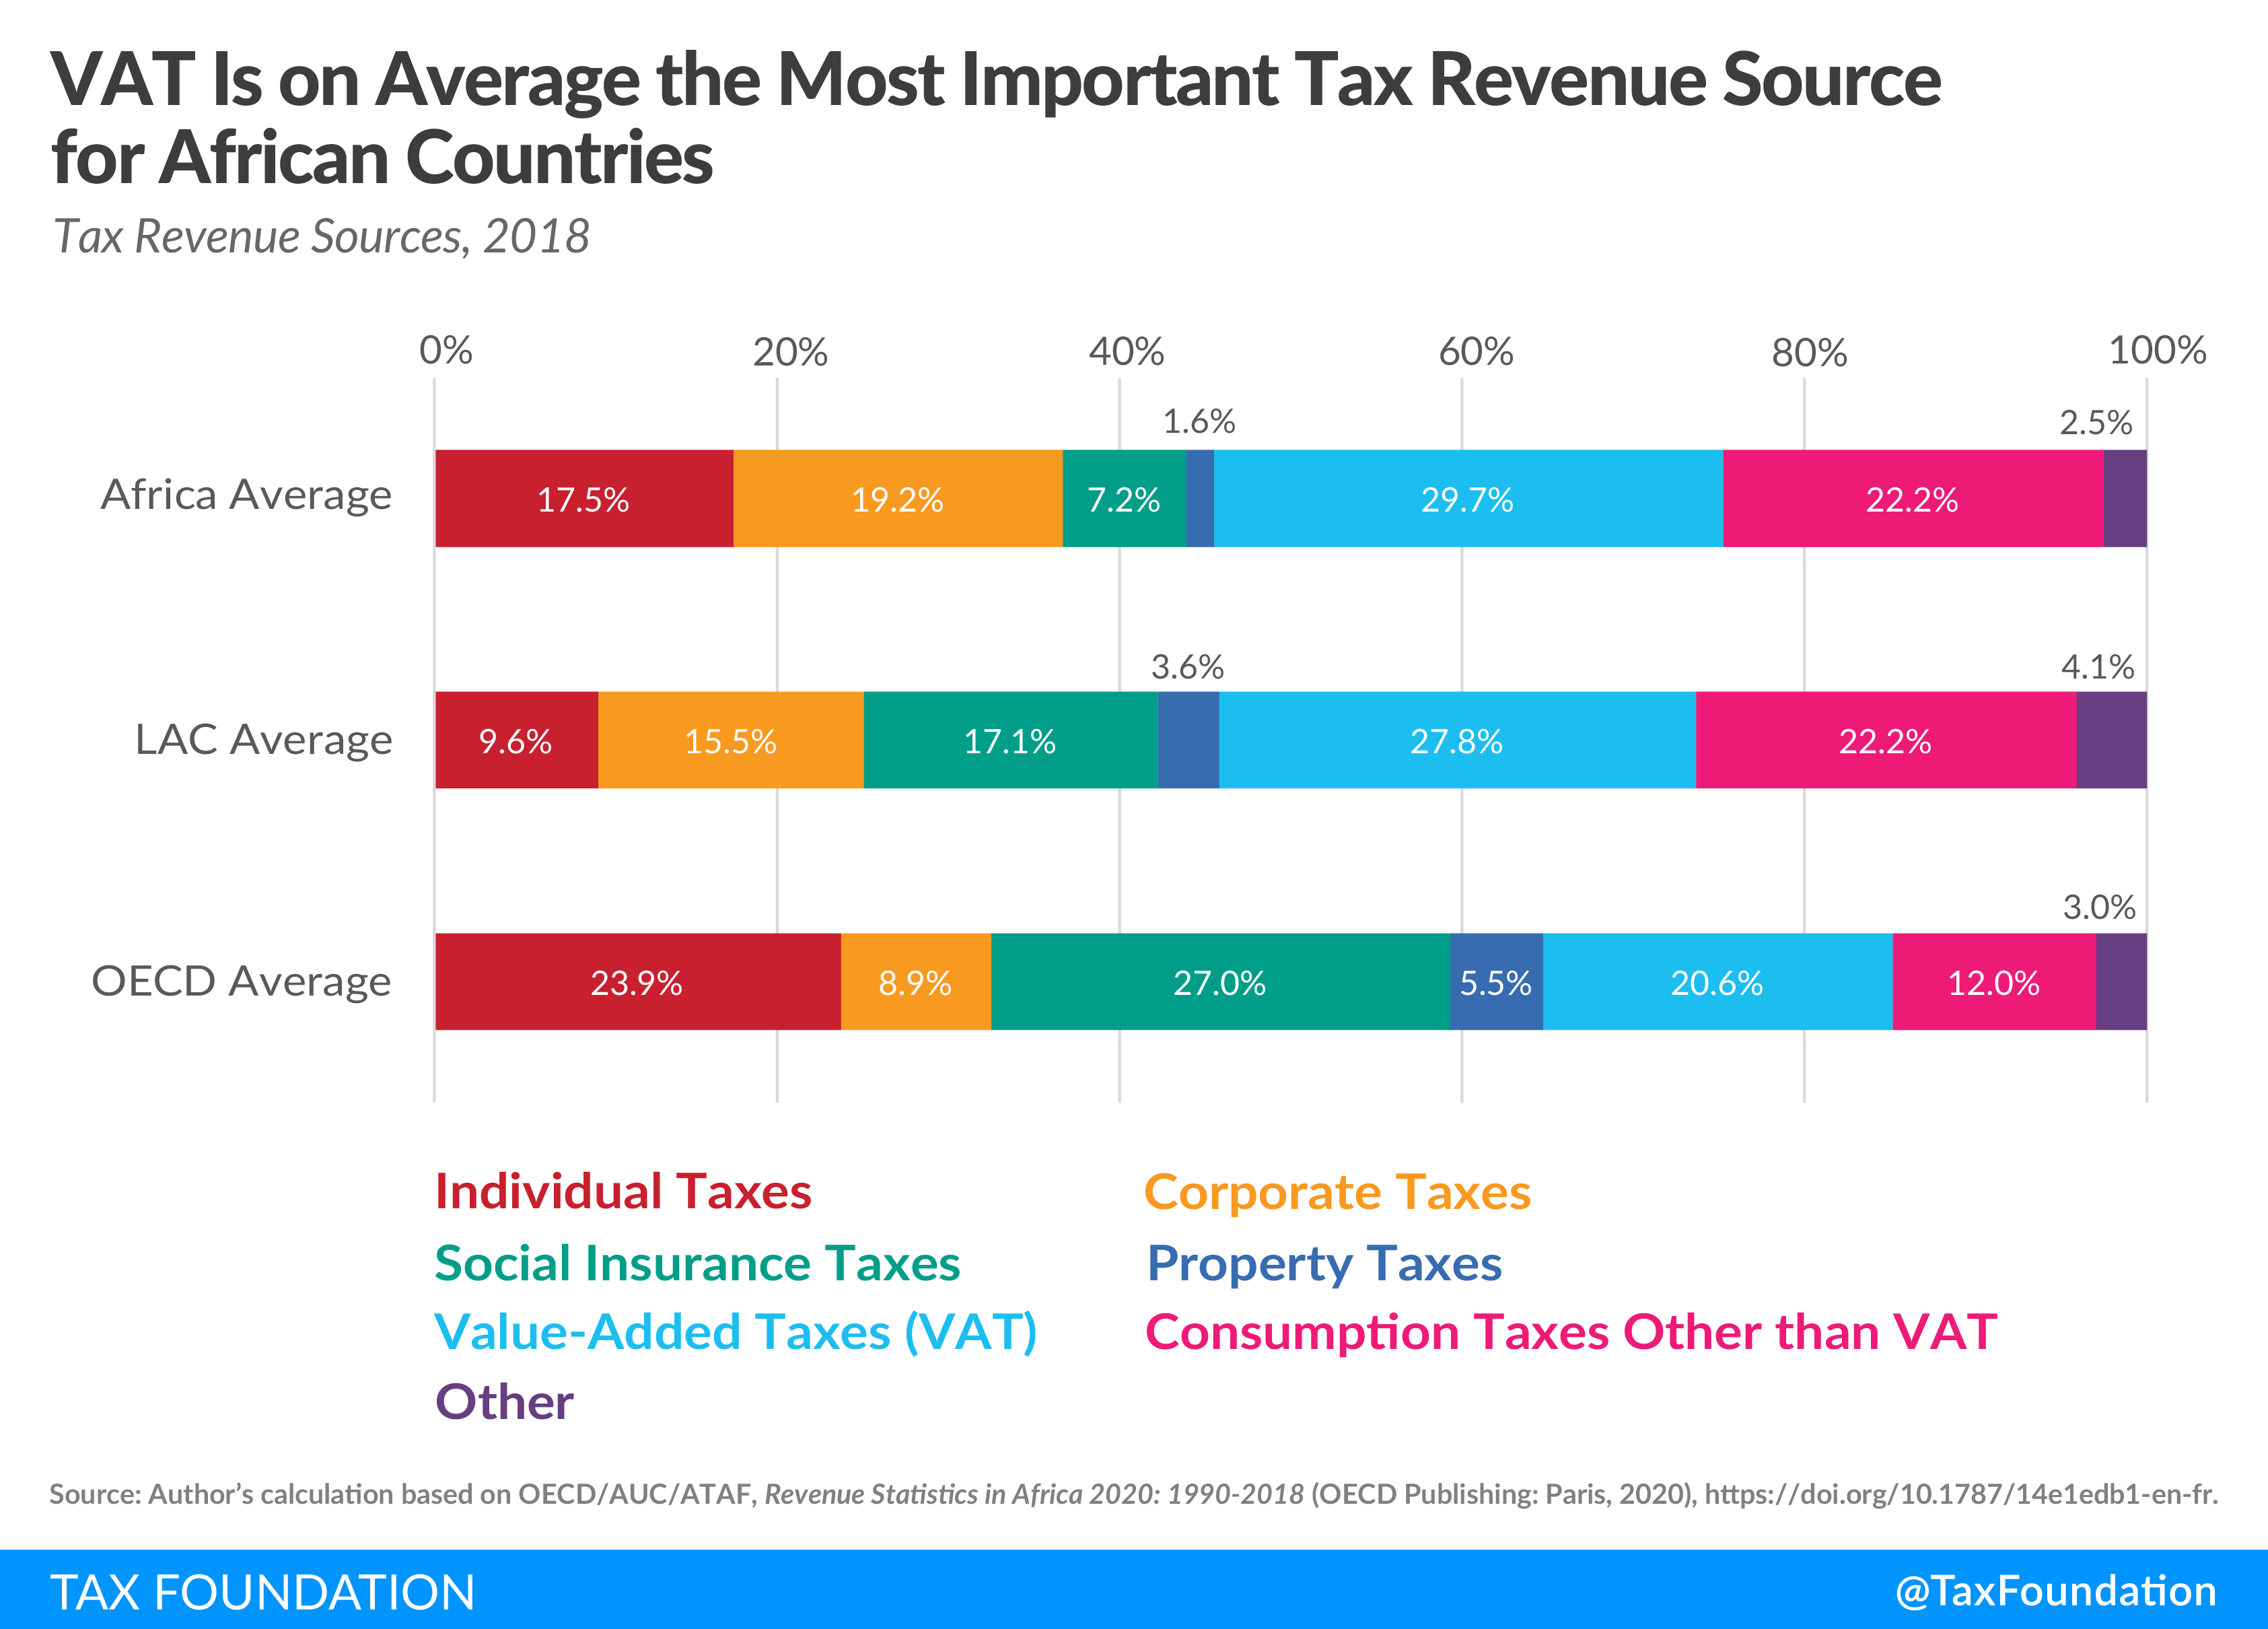
4.2 Total tax revenue and tax structure in some African countries

Source: Tax Foundation (2020), https://taxfoundation.org/africa-tax-revenue-oecd-report-2020/, (accessed 31/01/2023)
Source: Tax Foundation (2020), https://taxfoundation.org/africa-tax-revenue-oecd-report-2020/, (accessed 31/01/2023)
4.3 Income inequality within countries and the world
Yearly income per person (in PPP-adjusted 2005 $), by region of the world

ⓘ Farcaster, CC BY-SA 4.0, via Wikimedia Commons, Adaptation of Lakner, C., & Milanovic, B. (2016). Global Income Distribution: From the Fall of the Berlin Wall to the Great Recession. The World Bank Economic Review, 30(2), 203-232.